Please scroll down to view figures showing different aspects of the site’s water balance and carbon dioxide exchange for the current and preceding water year. In southern Arizona, the water year (as opposed to calendar year) begins around November 1st when the plant activity typically becomes dormant and substantial moisture in the soil is not used until the springtime.
To give feedback on these figures, please fill out a short survey here.
Figure credits and additional information: Russell Scott (russ.scott@usda.gov), Research Hydrologist, USDA-ARS, Tucson, AZ
1. Water balance
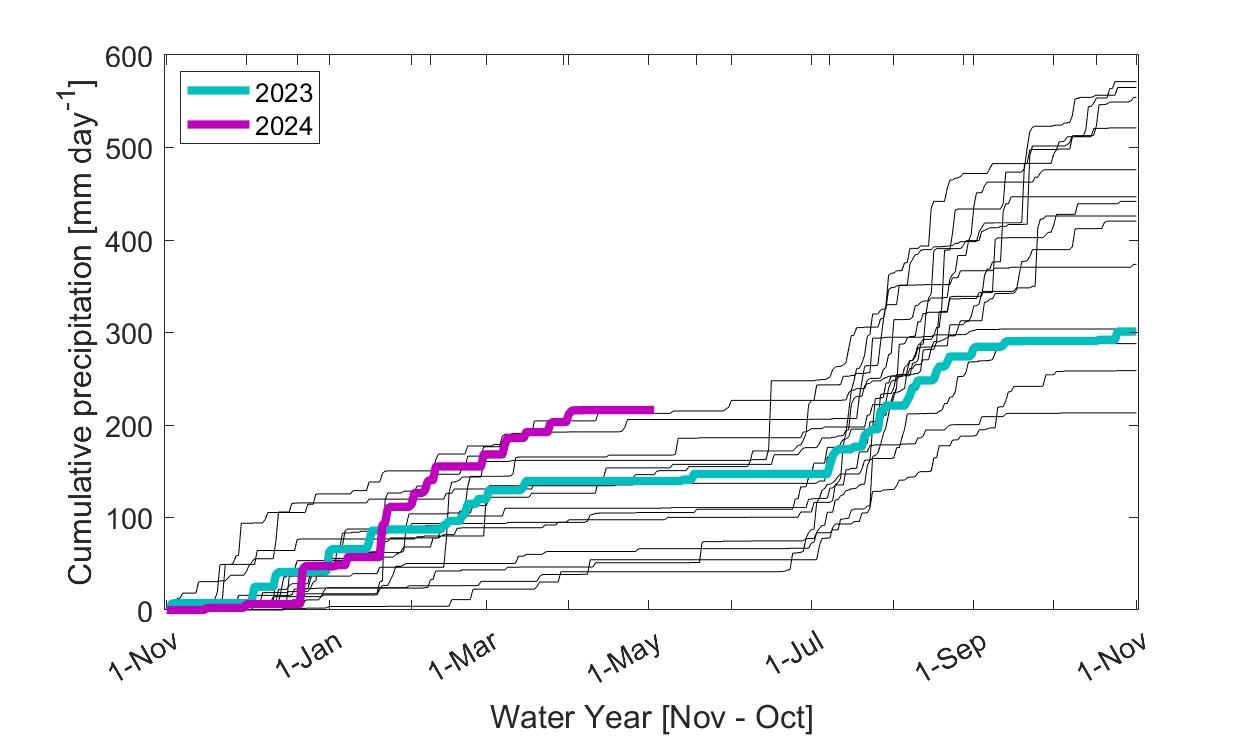
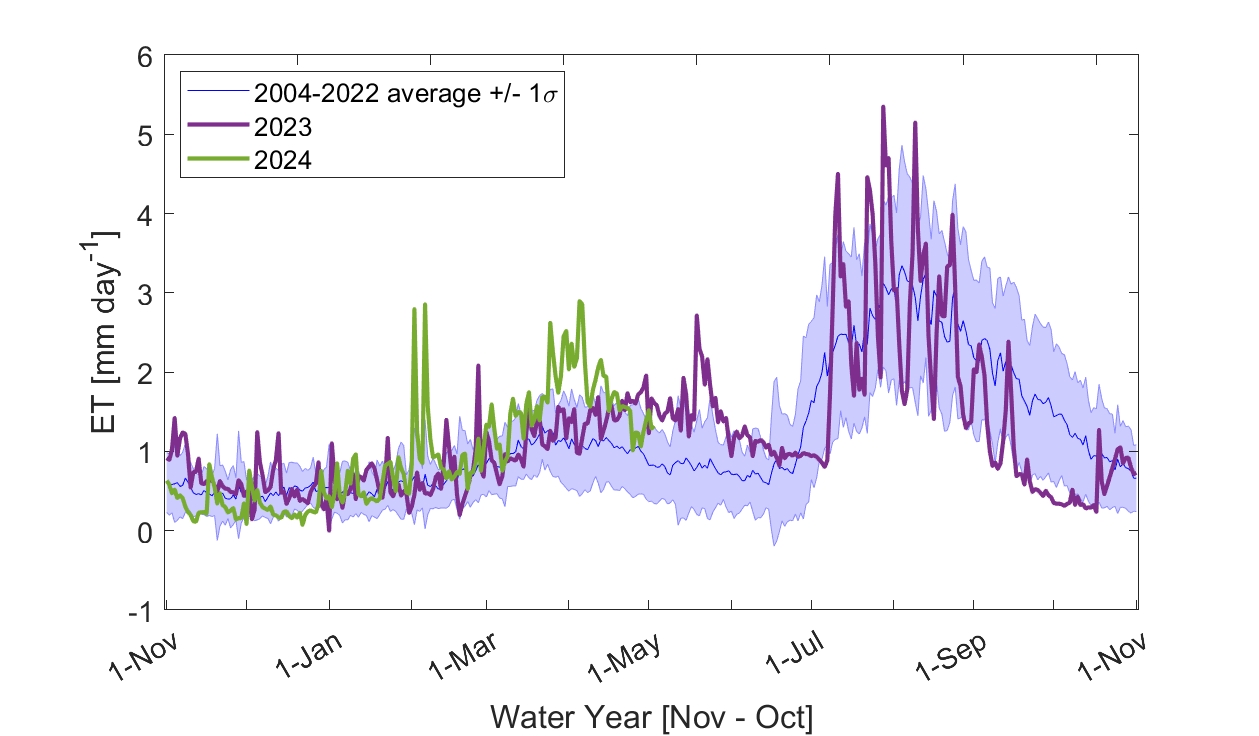
These graphs illustrate the amount of daily precipitation (P) and evapotranspiration (ET).
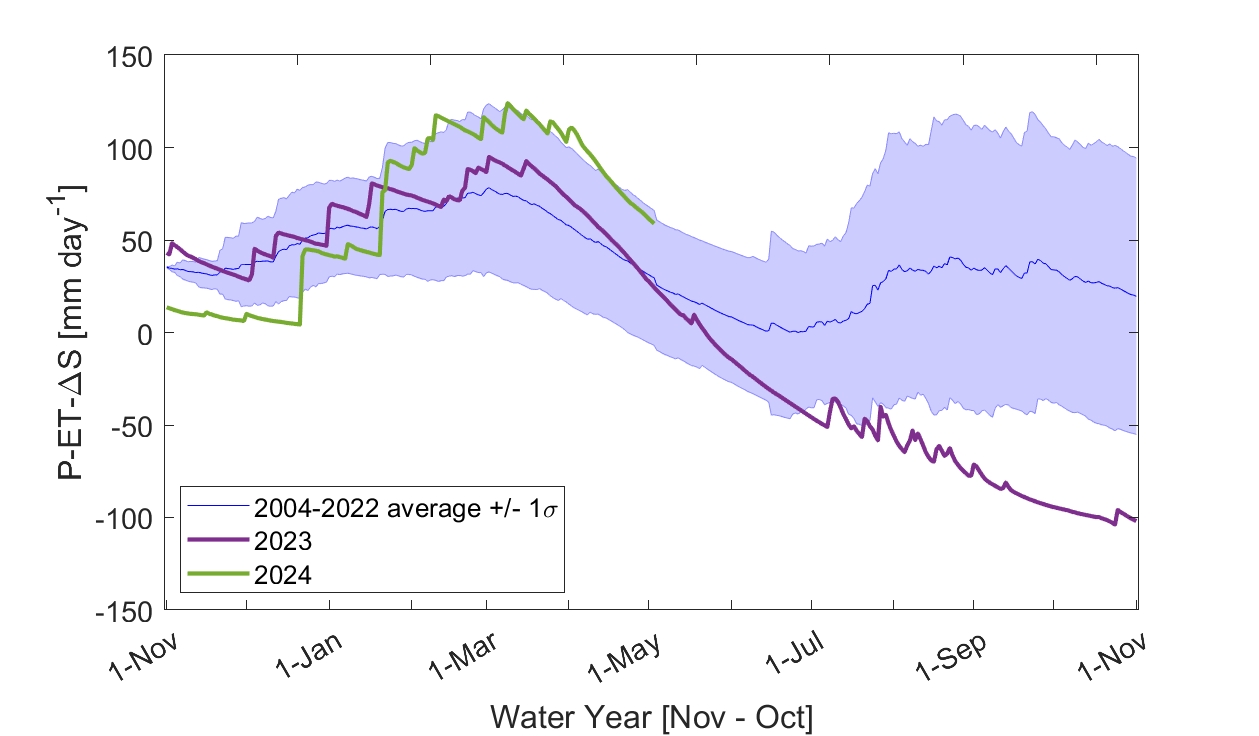
We also plot the difference between these two as well as we subtract out any storage deficit of soil moisture in the top 1 m of soil from the previous year to try and account for any carryover of moisture from the previous year.
2. Carbon Exchange
This graph illustrates the total amount of carbon dioxide taken in from atmosphere by the land or ecosystem via photosynthesis. It is a measure of the site’s vegetation productivity.
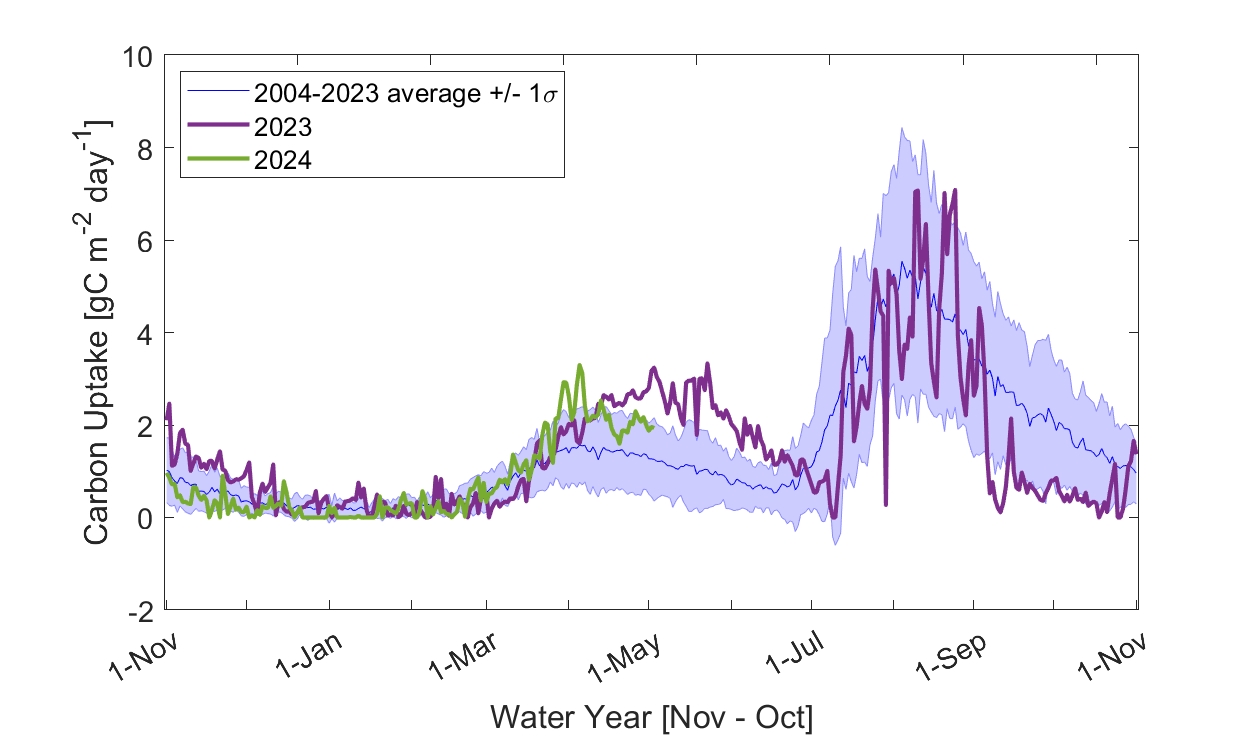
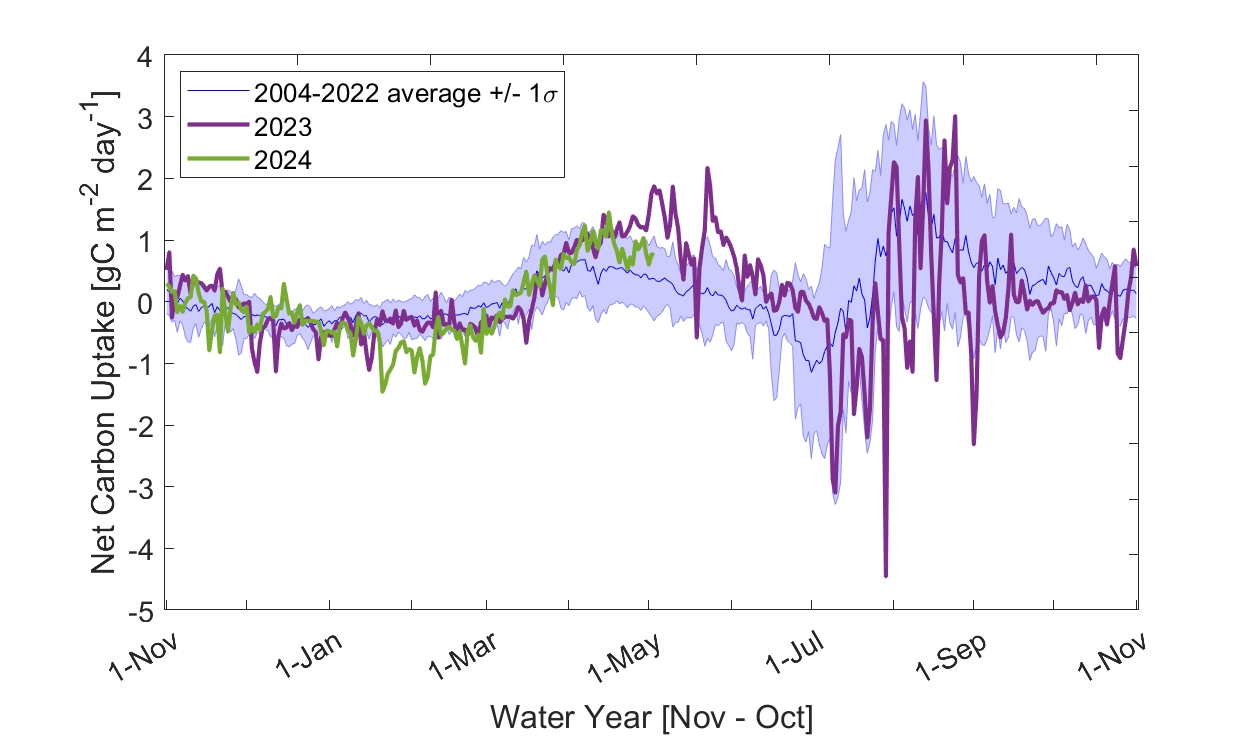
This graph shows the net amount of carbon dioxide exchanged between the atmosphere and the ecosystem. Positive values indicate a net uptake, and negative values indicate a net loss of carbon. In contrast to the graph above, here we are also accounting for how much of the carbon dioxide is emitted back to the atmosphere through the process of respiration, where microbes in the soil and plants consume carbohydrates garnered by photosynthesis and emit carbon dioxide to live and grow.
